Looker Studio Funnel Dashboard
Funnel Dashboard Project Overview
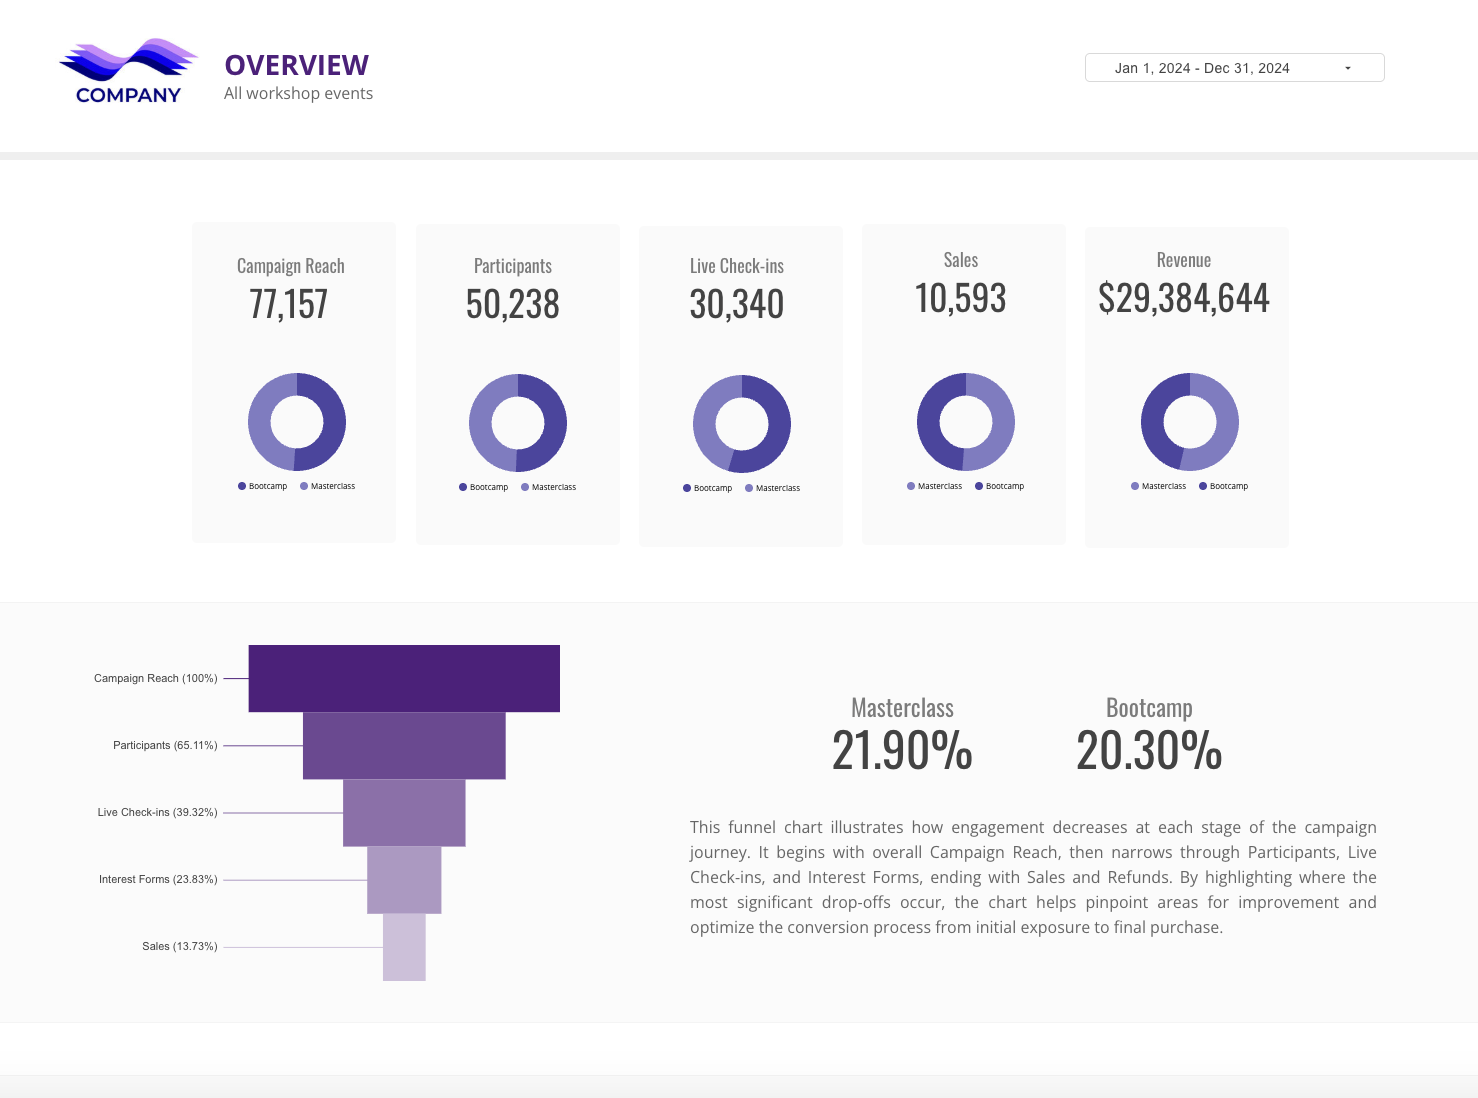
Many event organizers struggle to understand which events actually drive revenue and which fall short. Missing insights often mean wasted marketing spend, missed revenue opportunities, and uncertainty when planning future events.
We built a Looker Studio funnel dashboard for a financial education company that tracks conversions and revenue across all workshops, highlights top- and bottom-performing events, and consolidates data from Google Sheets into a single, interactive view. This gives teams clear, actionable insights to optimize campaigns and maximize returns.
Dashboard Results and Performance
Funnel Dashboard Data Visualization and Analytics Process
test
Data Collection and Requirements
Data Modeling and Looker Studio Setup
Visualization, Insights & Optimization
More Dashboards
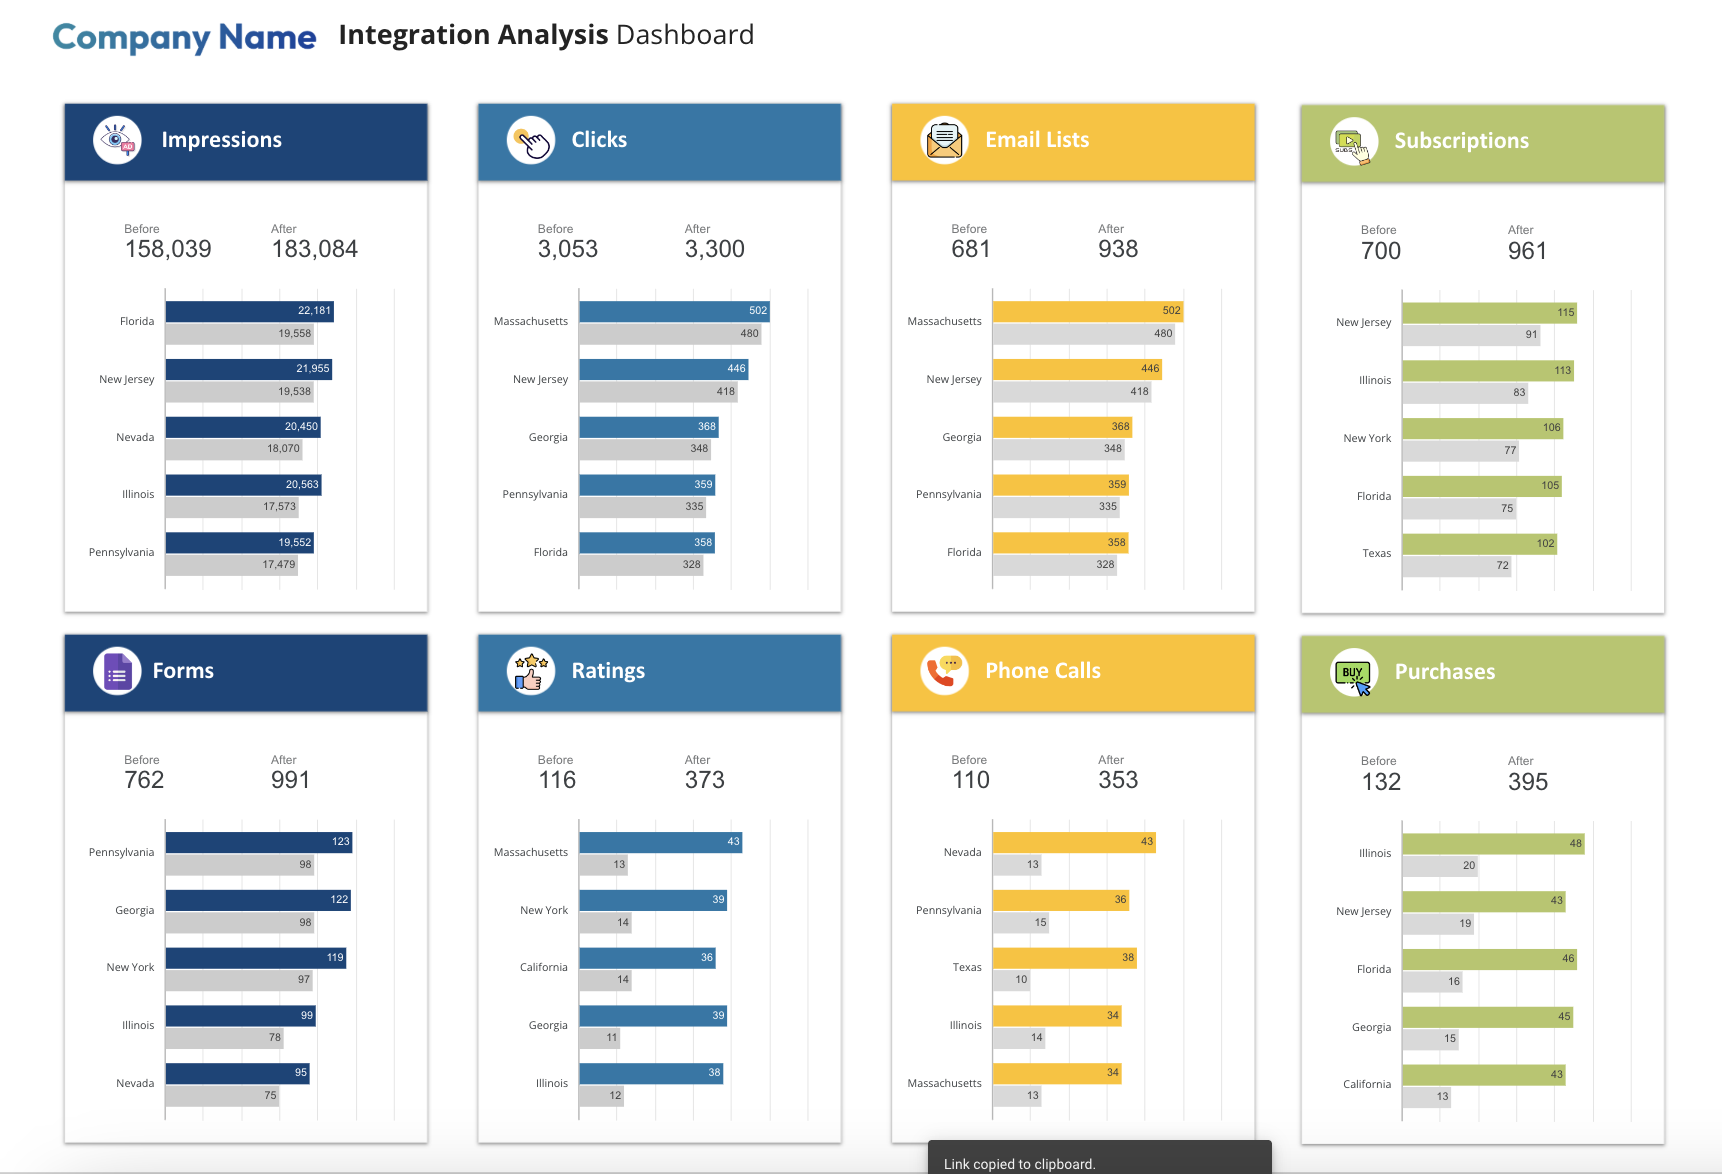
Integrations Report
Looker Studio Funnel Dashboard

Sales and Operations Report

Real Estate Report
Frequently Asked Questions
Developing the Looker Studio dashboard initially took less than a week, but ongoing client requests and regular data updates extended the project timeline to several months.
The project leveraged Google Sheets as the primary data source, where data was modeled and pre-aggregated, and Looker Studio for dashboard development, including design, calculated fields, and interactive visualizations.
YES! If you’re looking for a solution that turns event data into decisions, we can design a dashboard tailored to your KPIs, data sources, and business goals.